How often do you think about cheese? Honestly, I think about it at least once a day. But, for most people that is not the case. Do you know where the cheese you consume comes from? Do you know how much of it you actually consume? Do you know the benefits of eating cheese? We put cheese on almost everything we eat, but most people don’t know much about it. This post is exactly what it is titled: Cheese at a glance.
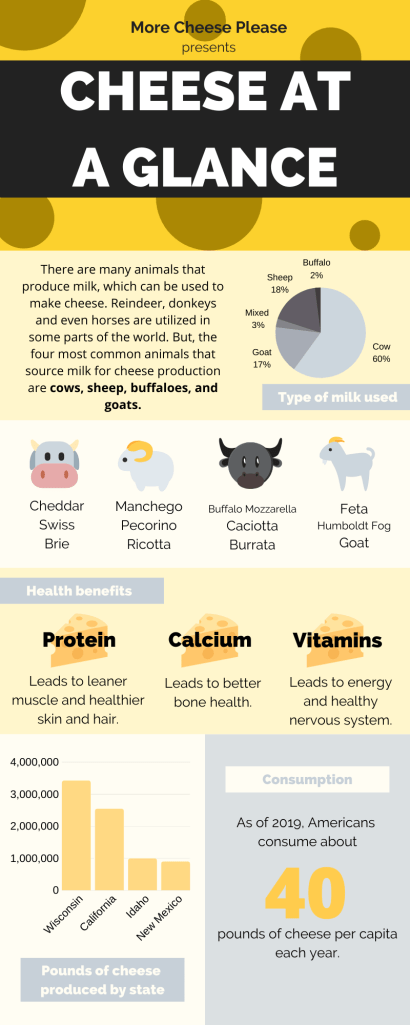
Hopefully, this helped you learned something new and feel a little more educated about one of your favorite foods. You can find more information and statistics on the U.S. Census Bureau’s 2019 National Cheese Day posting (which is only 74 days away!).
